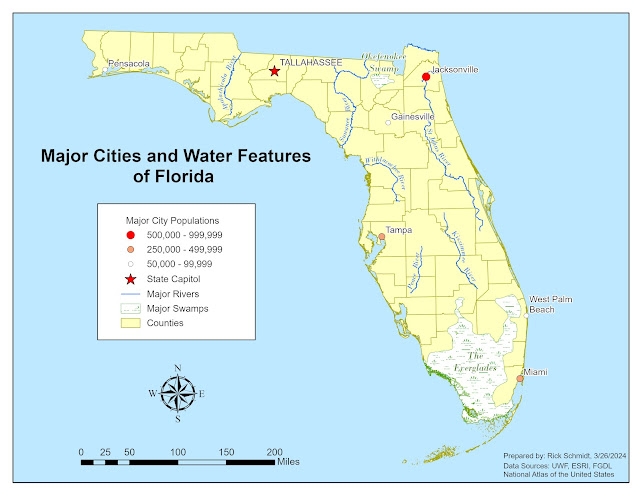
This week's lab module for Computer Cartography 5007L focused on labeling a map by following established typographic principles. We learned where and how to place our labels for different feature types such as major cities, rivers, and swamps. These types of features represent the feature types you find on a map which are points, lines, and areas. We learned the details of how to properly label these features by creating annotation feature classes. this allows you to edit each annotation feature so that you have full control over the position, size, and style of your labels which leads to the optimization of the presentation of your map. Our lab assignment involved creating a map of the state of Florida using ArcGIS Pro that displays the major cities, rivers, and natural features. Below is my finalized map.
Friday, March 29, 2024
Computer Cartography - Module 2 - Typography
In addition to creating our map, we were challenged with making at least three customizations. The first customization I chose
for my map was changing the point symbol for the city of Tallahassee to a red star
to designate it as the Capitol of Florida. I also choose to display the text in
caps to differentiate it from the rest of the cities. For the remainder of the
major cities, I decided to represent them according to population range with unique
values and point symbols of varying sizes. In addition, I used different
colors to represent the ordinal values associated with the population ranges. Another
customization I made was to change the swamp/marsh feature to a swamp symbol
and change it to a green color. It seemed to be a nice contrast to the Yucca Yellow
that I chose for the county layer. I chose to label the swamp/marsh features in
a similar green color as the features with Bodoni MT with italics that I also used for
my rivers. Although my label
was outside of the feature for the Okefenokee Swamp it remained legible against
the Yucca Yellow of my county layer and the blue background, especially with a minimal halo. Overall, I am very excited about what I learned in this lab module. Knowing how to convert labels to annotation features will greatly increase the quality of the maps I create moving forward.
Subscribe to:
Post Comments (Atom)
GIS Job Search
This week we were tasked with either revisiting our initial GIS dream job or conducting a new GIS job search to check out what types of jobs...
-
In Module 6, we learned about Suitability and Least Cost Path Analysis. We were introduced to performing suitability analysis using both vec...
-
Our final project involved analyzing a proposed transmission line corridor by Florida Power and Light (FPL) in Manatee and Sarasota Counties...
-
This week's lab module for GIS 5027L Remote Sensing and Photo Interpretation focused on supervised vs unsupervised classification of ima...


No comments:
Post a Comment